D3 (or D3.js) is a JavaScript library for visualizing data using web standards like SVG, Canvas and HTML. D3 combines powerful visualization and interaction techniques with a data-driven approach to DOM manipulation, giving you the full capabilities of modern browsers and the freedom to design the right visual interface for your data.
In the below example, SVG has been used. SVG has a coordinate system that starts from the top left corner (0;0). Positive x-axis goes to the right, while the positive y-axis goes to the bottom.
A margin value has been defined to provide padding to the chart. Padding has been applied with a
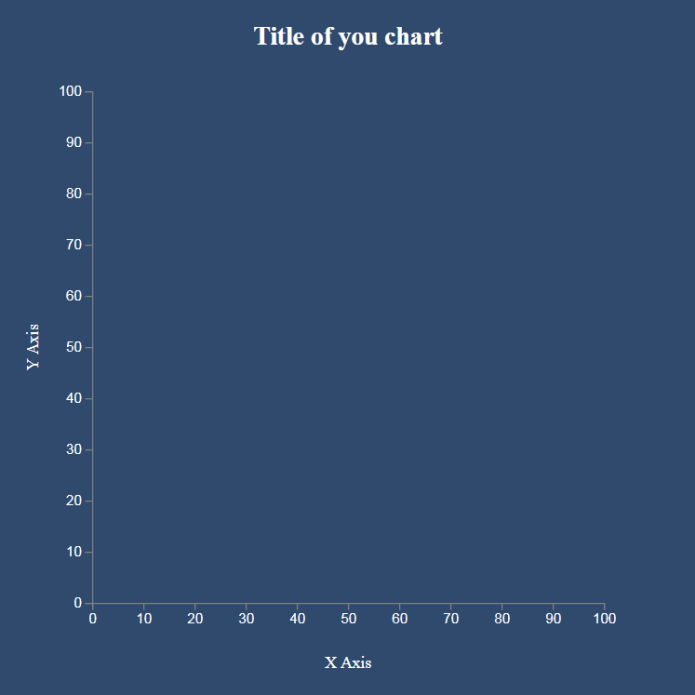
Let’s go on with the axes of the chart. In order to draw the y-axis, the lowest and the highest value limit which in this case are 0 and 100 has been used. Linear scale is the most commonly known scaling type.
Diagram will look like below:

Please copy and paste the below code for testing. Diagram will look like below:
<html lang="en">
<head>
  <meta charset="UTF-8"/>
  <meta name="viewport" content="width=device-width, initial-scale=1.0"/>
  <meta http-equiv="X-UA-Compatible" content="ie=edge"/>
  <title>d3js example of d3 axis</title>
  <script src="https://d3js.org/d3.v5.min.js"></script>
</head>
<body>
  <div id='layout'>
    <div id='container'>
      <svg />
    </div>
  </div>
</body>
<script>

    const svg = d3.select('svg');

    const margin = 80;
	const width = 600 - 2 * margin;
    const height = 600 - 2 * margin;

    const chart = svg.append('g')
      .attr('transform', `translate(${margin}, ${margin})`);

	 const xScale = d3.scaleLinear()
      .range([height, 0])
      .domain([100, 0]);

    const yScale = d3.scaleLinear()
      .range([height, 0])
      .domain([0, 100]);

    chart.append('g')
      .attr('transform', `translate(0, ${height})`)
      .call(d3.axisBottom(xScale));

    chart.append('g')
      .call(d3.axisLeft(yScale));

	svg.append('text')
      .attr('class', 'label')
      .attr('x', -(height / 2) - margin)
      .attr('y', margin / 2.4)
      .attr('transform', 'rotate(-90)')
      .attr('text-anchor', 'middle')
      .text('Y Axis');

	svg.append('text')
      .attr('class', 'label')
      .attr('x', width / 2 + margin)
      .attr('y', height + margin * 1.7)
      .attr('text-anchor', 'middle')
      .text('X Axis');

	svg.append('text')
      .attr('class', 'title')
      .attr('x', width / 2 + margin)
      .attr('y', 40)
      .attr('text-anchor', 'middle')
      .text('Title of you chart')
</script>
<style>

div#container {
  width: 600px;
  height: 600px;
  margin: auto;
  background-color: #2F4A6D;
}

svg {
  width: 100%;
  height: 100%;
}

text {
  font-size: 12px;
  fill: #fff;
}

path {
  stroke: gray;
}

line {
  stroke: gray;
}

text.label {
  font-size: 14px;
  font-weight: 400;
}

text.title {
  font-size: 22px;
  font-weight: 600;
}

</style>
</html>
- 31 reads
