During application performance investigation or troubleshooting, we highly rely on PerfMon, which is Windows Performance Monitoring tool. This is an excellent tool you can use to get a lot more insight about the OS, Resources like CPU, Memory etc. Applications and so on. The capture data can help you to identify application performance bottlenecks and save your time.
Let me guess, you are here, because while investigating the performance issue of your IIS application (assuming it is .NET application), you have captured data for IIS worker processes for their individual usage of CPU and memory etc and you have multiple application setup in your IIS. Now the perf mon data is showing w3wp#1, w3wp#2, w3wp3 so on as your instance and you are lost how to map these instances to the actual IIS application.
Okay, if not you, then at least I was in that position recently and this is how I managed to get those data related to my actual IIS application.
I captured the Process => %processor time, .NET CLR Memory=>% time in GC, Process => Working Set - Private, Process => Thread Count etc. for all my worker process instances.
Below is an example of total processor time versus processor time that some individual w3wp worker process has consumed during a load testing was in progress.
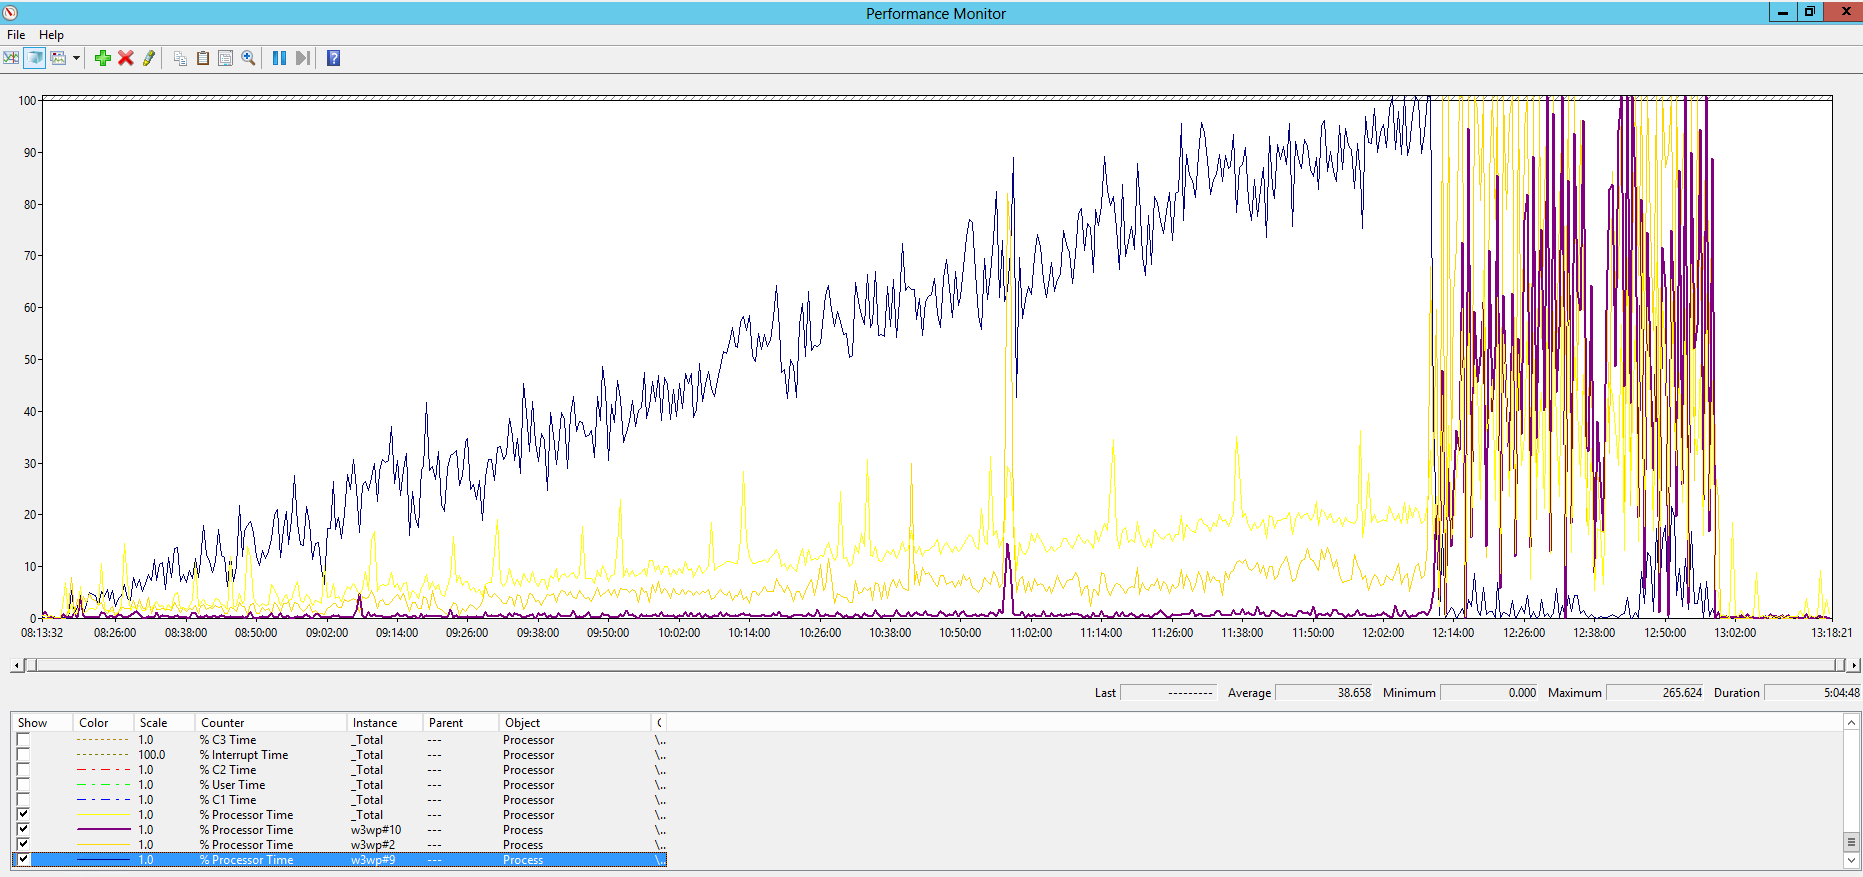
Now from the screenshot above, it is evident that total CPU usage of the web server was hardly 50% is in use but w3wp#9 has continuously increased and at some point, it reached its limit.
Surprising isn’t it? It was the same for me too. Throughout load testing Machine’s CPU usage was never reached beyond 50% but at some point, my application started throwing exceptions and showing irregularities of response time.
As next part of my investigation was what was that w3wp#9 worker process for. As in my case, load testing of the application involved multiple IIS applications. Then the question arises, which application it is and how to find it.
Two steps to find it.
1. Find the process ID of w3wp#N
2. Find the process ID worker processes from IIS
Find the process ID of w3wp#N
Go to perf mon again and add counter Process => ID Process for instance w3wp#N, in my case it was w3wp#9.
Select the counter and you’ll see the value same in Min, Average etc.
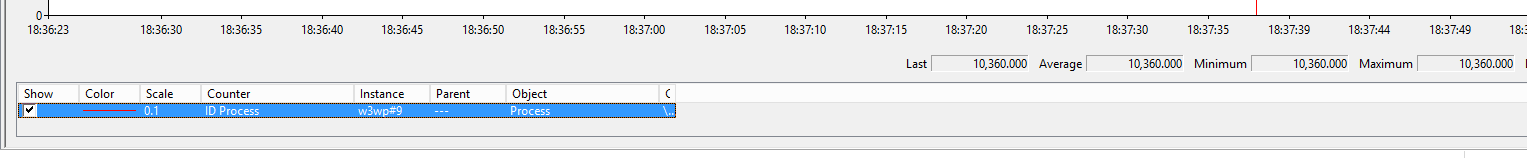
Great! I found process ID was 10360 for w3wp#9
Find the process ID worker processes from IIS
Go to IIS manager
Select root node and go to Worker Processes
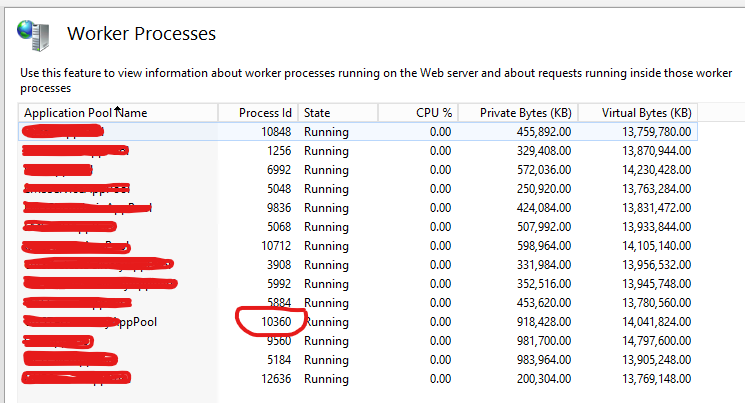
There you go, I found the process ID of the application pool name. Now find out from your list of applications which application is running by this application pool. That's it.
By the way, if you are wondering what the reason of such odd behavior of CPU usage was, that is because, in the application pool, the CPU usage was limited in Advanced settings of AppPool to use “Limit (1/1000 of %)” as 50000 and Limit action was “ThrottleUnderLoad”.
- 690 reads