When you are looking for resolution of below queries, you are at the right place.
- sql server most expensive queries using dmv.
- sql server find most expensive queries,
- recent expensive queries sql server,
- find most expensive queries in sql server,
- sql server recent expensive queries,
- most expensive query in sql server,
- expensive queries,
While you are worry about the performance of your application or your database, you can use this performance tips for SQL SERVER and find out most costly queries running from your application. This will help you find out expensive queries to tune them up and increase performance.
Whenever SQL Server executes a query or performs an operation. It generates all possible execution plans and finds the best one for execution. Then SQL server’s query optimizer preserves execution plans in the cache once it creates a worthy plan. We can get that execution plan to check whether it is using all the required indexes optimally. It also records how many times that execution plan get re-used by following execution. This will give us the count of the execution.
It also records the number of logical reads, logical writes, elapsed time etc. all this counter will help to find poor performer while monitoring SQL Server queries.
The query will use the Dynamic Management Views (DMV). DMV returns server state information that can be used to monitor the health of the server instance, diagnose problems and performance.
To query a DMV, you require SELECT permission on object and VIEW SERVER STATE or VIEW DATABASE STATE permission.
You can use this query as Performance Tips to find out your most expensive or costly queries in SQL Server.
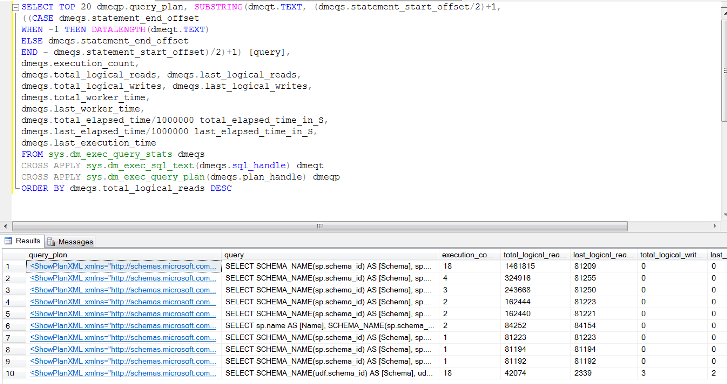
Below is the way to identify the most costly SQL Server queries using DMV.
SELECT TOP 10 dmeqp.query_plan, SUBSTRING(dmeqt.TEXT, (dmeqs.statement_start_offset/2)+1,
((CASE dmeqs.statement_end_offset
WHEN -1 THENDATALENGTH(dmeqt.TEXT)
ELSE dmeqs.statement_end_offset
END - dmeqs.statement_start_offset )/2)+1) [query],
dmeqs.execution_count,
dmeqs.total_logical_reads, dmeqs.last_logical_reads,
dmeqs.total_logical_writes, dmeqs.last_logical_writes,
dmeqs.total_worker_time,
dmeqs.last_worker_time,
dmeqs.total_elapsed_time/1000000 total_elapsed_time_in_S,
dmeqs.last_elapsed_time/1000000 last_elapsed_time_in_S,
dmeqs.last_execution_time
FROM sys.dm_exec_query_stats dmeqs
CROSS APPLY sys.dm_exec_sql_text(dmeqs.sql_handle) dmeqt
CROSS APPLY sys.dm_exec_query_plan(dmeqs.plan_handle) dmeqp
ORDER BY dmeqs.total_logical_reads DESC

If you are running this query from SSMS, you can click on the query_plan to view the graphical representation of the execution plan.
If you have been provided the execution result through other media like excel or text then you need to copy the XML of the execution to a separate text file and save the file with extension .sqlplan.
Then opening that file in SSMS, it will show you in graphical format.
- 6667 reads

Comments
Good Article
Thanks for sharing this article and script.